Infrastructure Monitoring
Get complete visibility into your cloud infrastructure performance at any scale, easily access all your metrics in one place and optimize infrastructure efficiency.


Track everything
groundcover infrastructure monitoring solution is built for cloud-native environments so you can track the health and efficiency of your infrastructure immediately with effortless deployment.

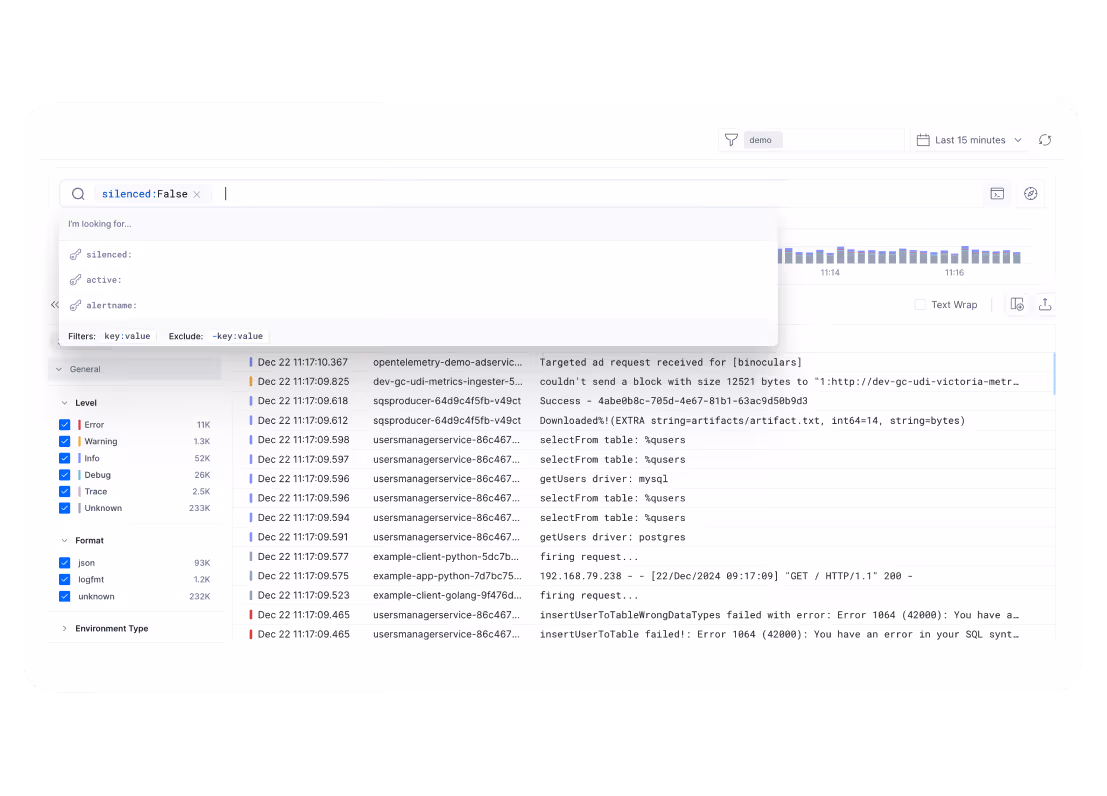
Troubleshoot efficiently
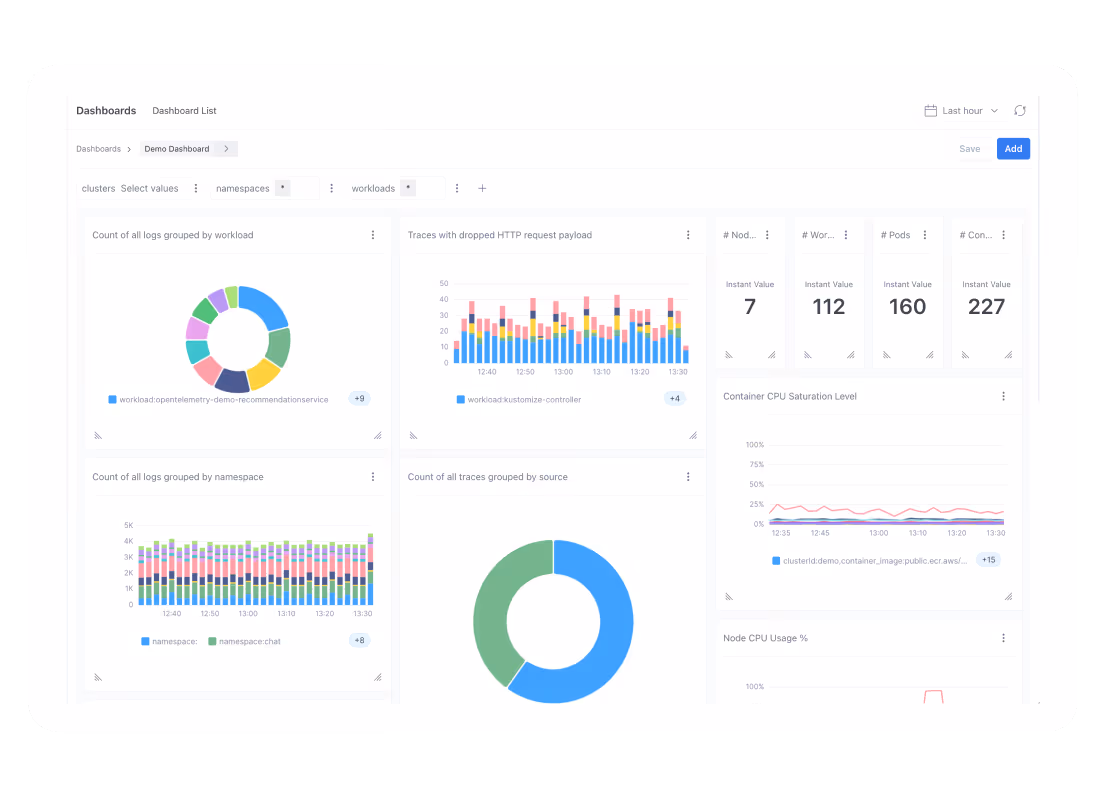
groundcover offers a centralized place for all your infrastructure, application and customer metrics so you can query, correlate and troubleshoot with real time data around your entire stack.

Store it all, without a sweat
groundcover lets you store metrics without worrying about cardinality or retention limits. Store everything, and pay the same - regardless of the granularity of metrics you store or query.
Cover your entire stack
- Easily monitor tens of thousands of infrastructure metrics with groundcover’s propietary eBPF sensor.
- Seamlessly integrate your cloud metrics from serverless platforms, managed databases and more.
- Control metric retention and investigate with continuous historical infrastructure data.
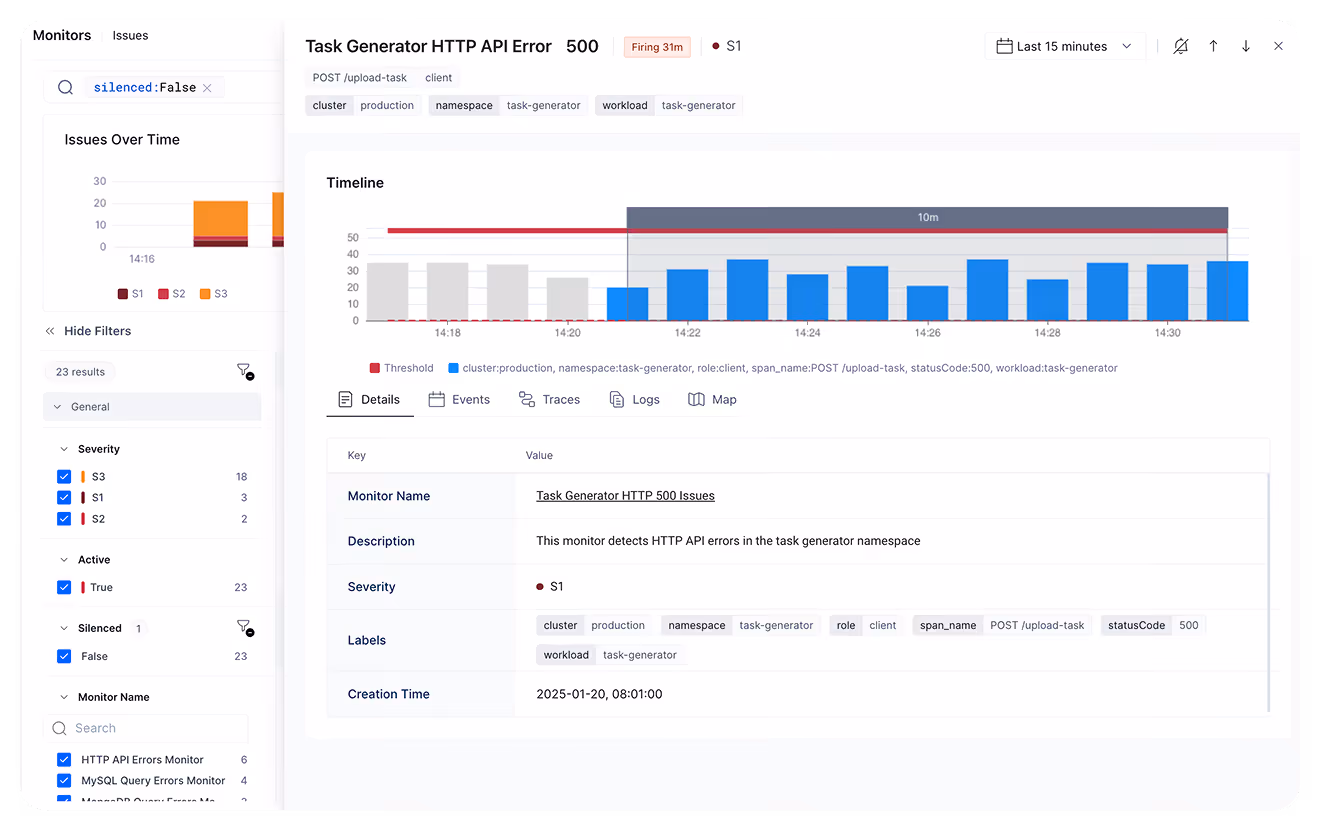
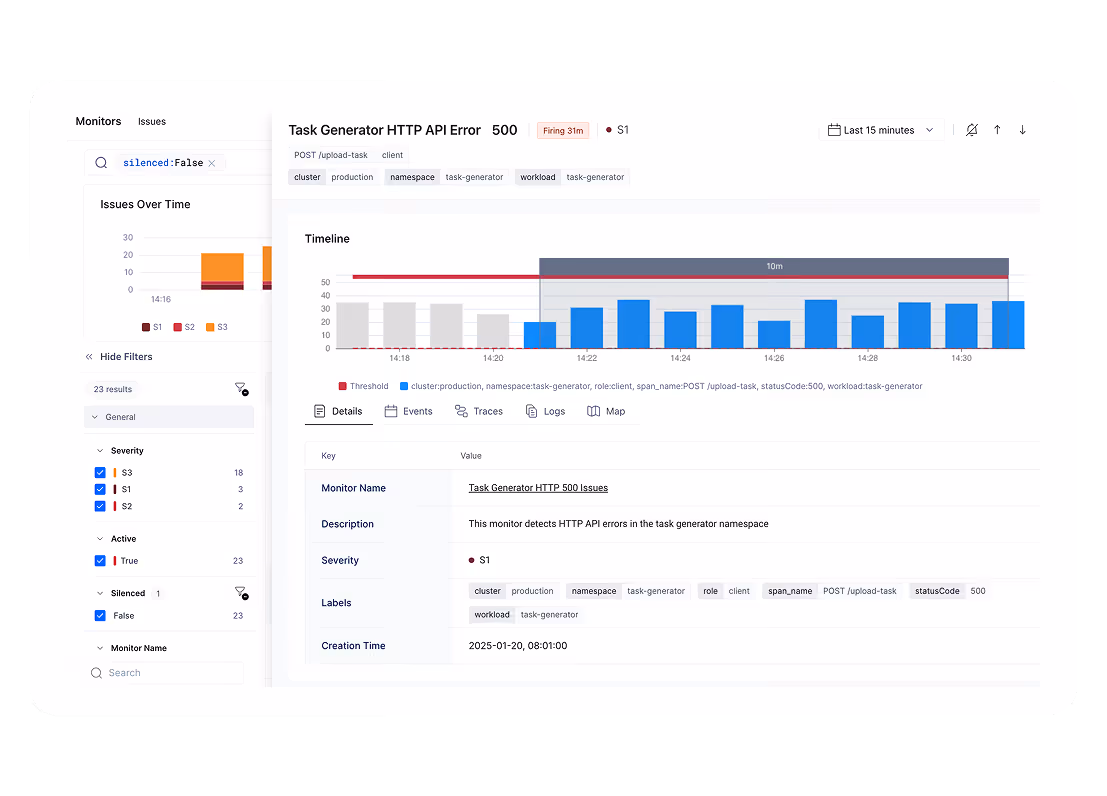
Detect Infrastructure issues, faster
- Troubleshoot any detected issue with the relevant metrics around a specific time.
- Steamline infrastructure and application in one comprehensive view.
- Correlate metrics with related logs and traces to instantly investigate a specific issue and find the root cause.
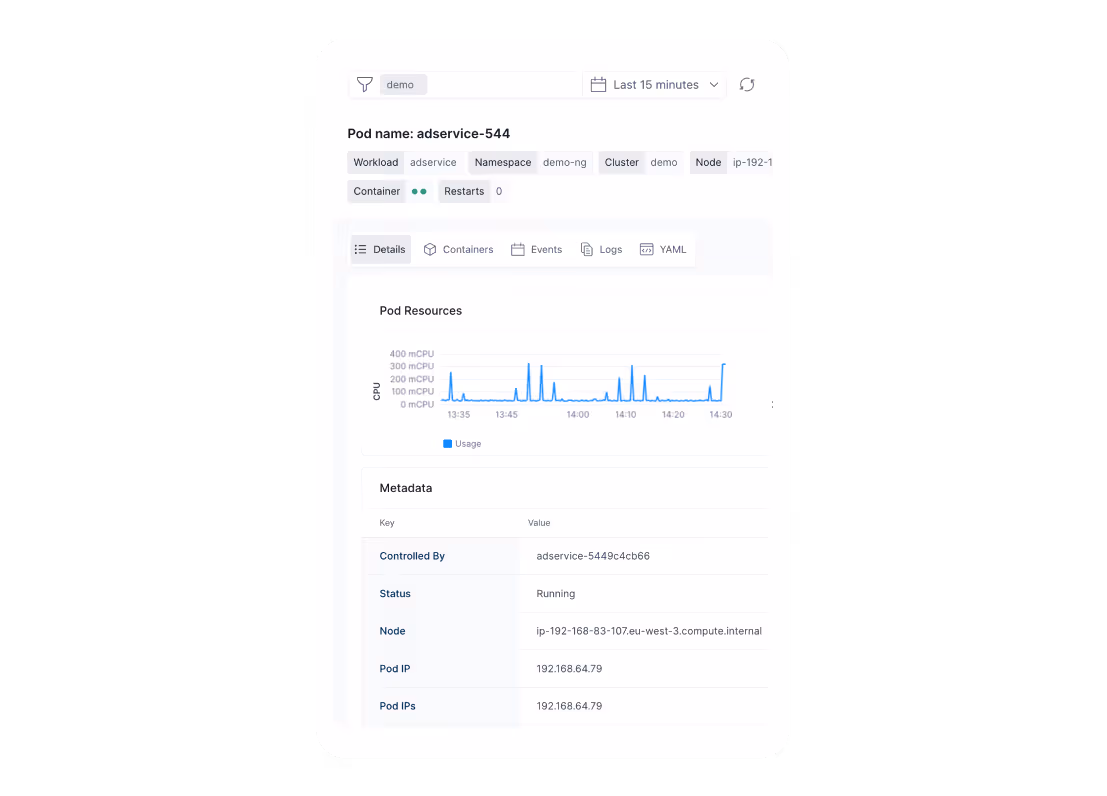
Complete Kubernetes Monitoring
- Full coverage of your Kubernetes environments - all in one centralized place.
- Track the health and utilization of all your Kubernetes entities from nodes to containers and workloads.
- Automatically detect infrastructure related failures like container crashes or over-utilization.
Custom visualizations & alerts
- Create custom dashboards and visualizations directly inside Grafana using PromQL.
- Aggregate metrics across the stack into one view.
- Easily create custom alerts on any metric query to monitor trends and issues.
Stream data processing
- No sampling; Ingest all data, all in real time, and never miss rare events again
- Data is processed and captured inside the sensor to reduce raw data volume stored
- Unlimited cardinality and data depth
Infrastructure
Monitoring FAQs
Everything you need to know about
Infrastructure Monitoring
Of course! groundcover supports integration of any Prometheus endpoint - by scraping or remote write.
Our architecture is tailor-made for modern cloud-native environments. Backed by best-of-breed technologies like VictoriaMetrics we’re able to create a highly cost-effective observability backend that can disrupt standard pricing models.
groundcover introduces a cloud-native approach to monitoring. It supports high scale and unlimited metrics cardinality , correlates any metric with the related logs, traces and events from any source in your cloud environment. And the last great advantage - it doesn’t price by metrics cardinality or retention period, at all.
Explore More groundcover products
Discover additional groundcover capabilities that work seamlessly with Synthetics.

Integrations
Connect groundcover to your existing stack, from cloud providers to alerting tools, with out-of-the-box integrations and zero custom pipelines.
Synthetic performance monitoring
Proactively simulate user journeys and API flows to detect issues before your customers do, with no code changes required.
BYOC Architecture
Your observability data plane runs inside your own cloud. Full fidelity telemetry, zero egress fees, and complete control over data residency.
Observability
for what comes next.
Start in minutes. No migrations. No data leaving your infrastructure. No surprises on the bill.


.svg)