Application Performance Monitoring (APM)
Gain end-to-end observability into your applications performance, identify and resolve issues instantly - all with zero code changes.


Cover everything
Our Log Management solution is built for high scale and fast query performance so you can analyze logs quickly and effectively from all across your cloud environment.

Resolve faster
Each log data is enriched with actionable context and correlated with relevant metrics and traces in one single view so you can find what you’re looking for and troubleshoot, faster.

Improve user experience
groundcover is a centralized log management that lets you log without limits. Store everything, and pay the same - regardless of the volumes of logs you store or query. Your data, your call.
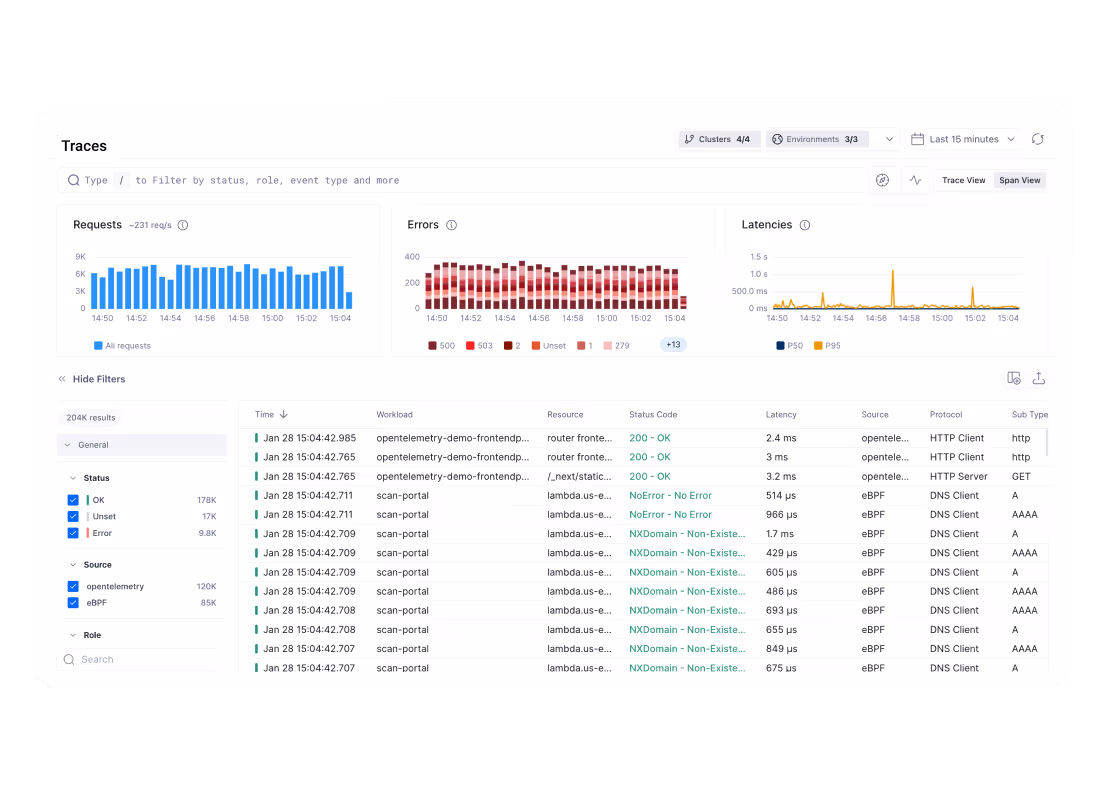
Out-of-the-box application tracing
- Deploy in seconds and cover your entire stack using the power of eBPF.
- Cover API calls, database queries, message queues and network calls without any changes to your application code.
- Search and filter traces instantly — with a simple query builder.
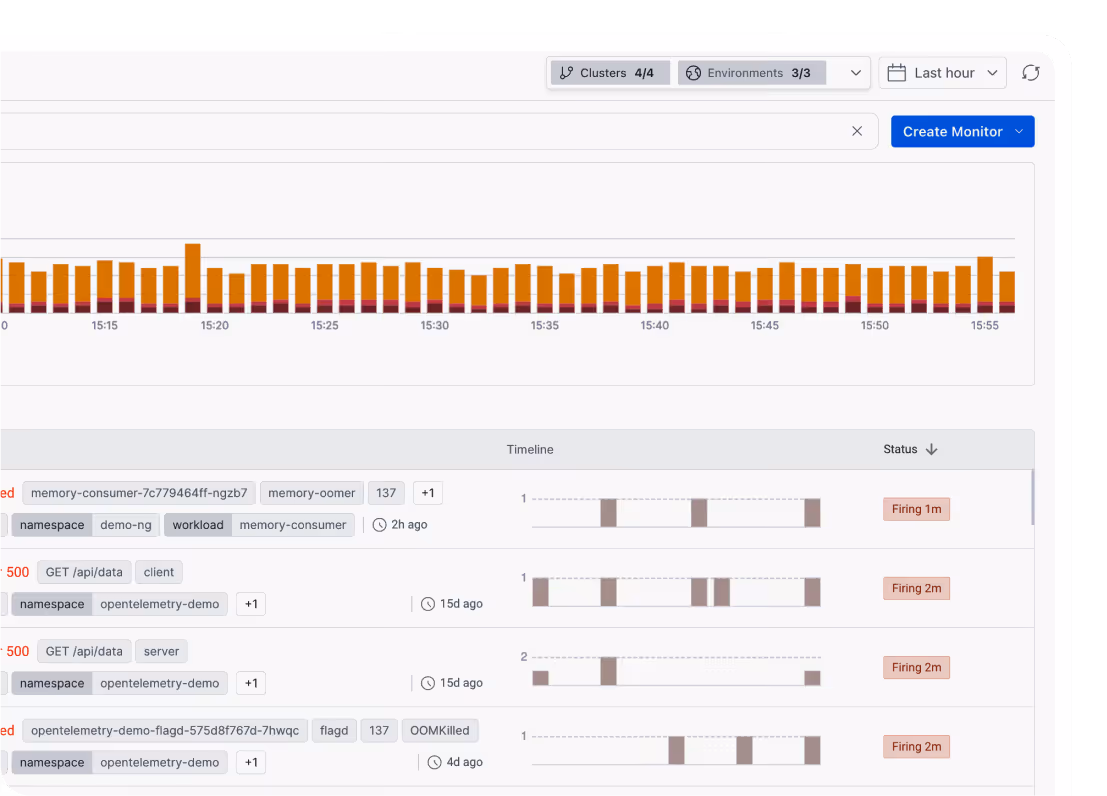
Troubleshoot and solve issues faster
- Automatically detect application issues and aggregate them into actionable insights.
- Troubleshoot fast with full request and response payloads from API calls and database queries.
- Identify and solve issues quickly by correlating traces with logs, metrics, and infrastructure events from across your stack.
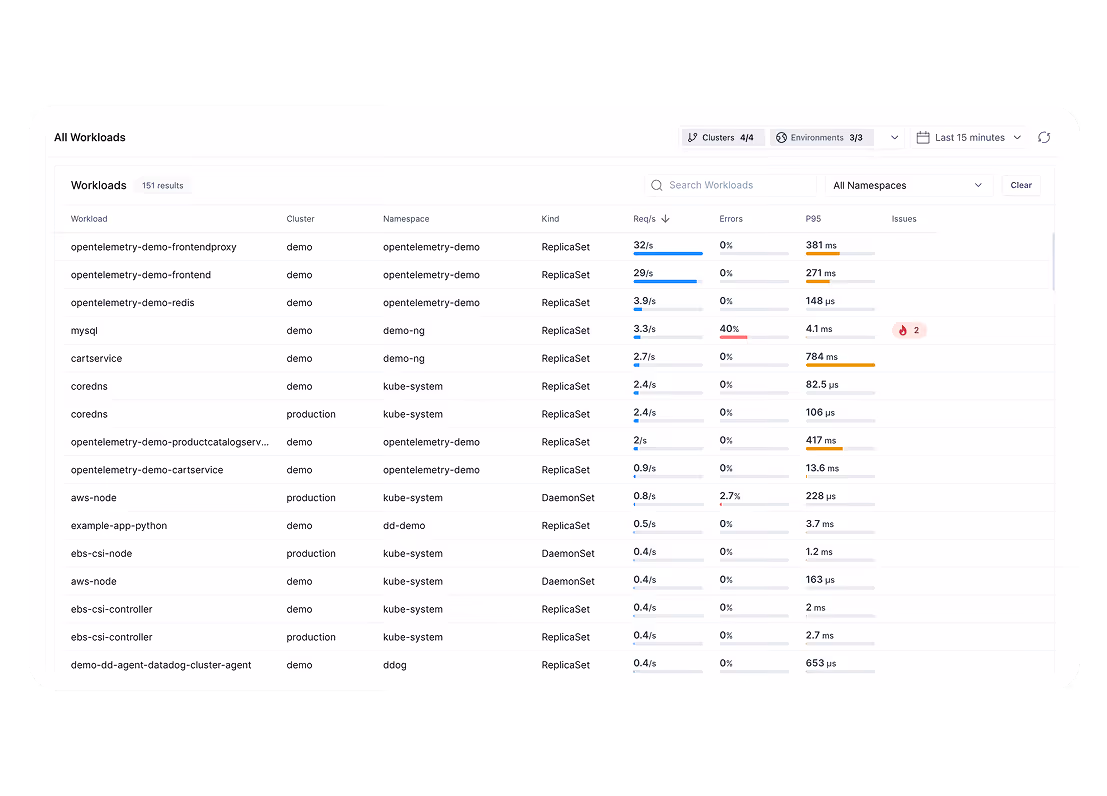
Improve application performance
- Detect application issues with one centralized view of all service-level golden signals like request throughputs, error rates and latencies.
- Detect request bottlenecks, slow queries and troubleshoot with detailed examples of problematic traces.
- Set proactive alerts around SLOs and health metrics to improve reliability and avoid unexpected downtimes.
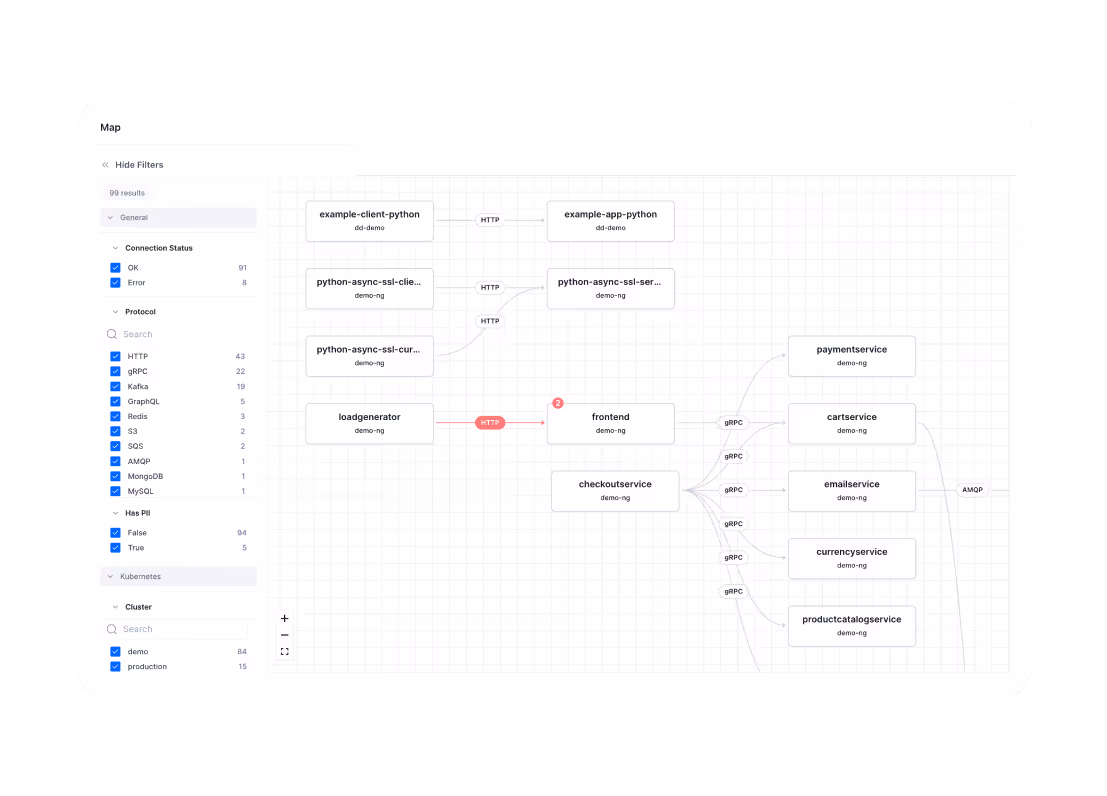
Live Network Dependency Map
- Visualize a live service dependency map to troubleshoot complex issues faster.
- Easily discover network bottlenecks and erroneous connections.
- Instantly dive deeper into a specific service to continue the investigation.
The single most cost-effective observability backend
- Resource efficiency and processing at the speed of ClickHouse & VictoriaMetrics
- Long-term data retention storage such as S3
- Cutting-edge sensor to inCloud data pipeline eliminates high networking costs
- Better use of cloud provider commitments to further discount costs
Application Performance Monitoring FAQs
Everything you need to know about Infrastructure Monitoring
We can customize billing plans to meet your needs. Contact sales → to learn more.
A Kubernetes host or any Linux host (of any size) that is actively monitored by the groundcover platform.
We keep track of the number of monitored hosts in each environment, and calculate the pricing based on the average number of hosts over the past month so you pay for your average host usage, and not for short-lived peaks.
groundcover uses a unique BYOC architecture that processes and stores all your observability data within the walls of your own Virtual Private Cloud (VPC). This cost-effective architecture allows us to break the customary ingestion-based pricing models, offering a solution with predictable and fair pricing.
Explore More groundcover products
Discover additional groundcover capabilities that work seamlessly with Synthetics.

Infrastructure Monitoring
Gain full visibility into your cloud performance, easily access all metrics in one place, and optimize efficiency.
groundcover MCP
Bring production-grade observability context directly into your AI agents and IDEs. Query logs, traces, and metrics in natural language, zero noise, zero setup.
Migration
Move from your existing observability stack to groundcover without friction, with guided migration paths and full coverage from day one.
Observability
for what comes next.
Start in minutes. No migrations. No data leaving your infrastructure. No surprises on the bill.


.svg)