
%201.webp)
March 31, 2025

Gilles Perez • Mar 31, 2025
Overview of the groundcover eBPF-based APM platform & plans
Q&A about product and any organizational customization needs
30-minute live technical product demo
By submitting this form you agree to our friendly privacy policy.

Monitor everything, deploy in minutes.
Cover your entire Kubernetes stack instantly
with no code changes.
Auto-detect issues across your entire cluster.
See it all. Store what matters. Pay Accordingly.

Explore groundcover’s one-click Kubernetes dashboards powered by eBPF. Simplify observability and monitor your clusters effortlessly—announced at KubeCon.
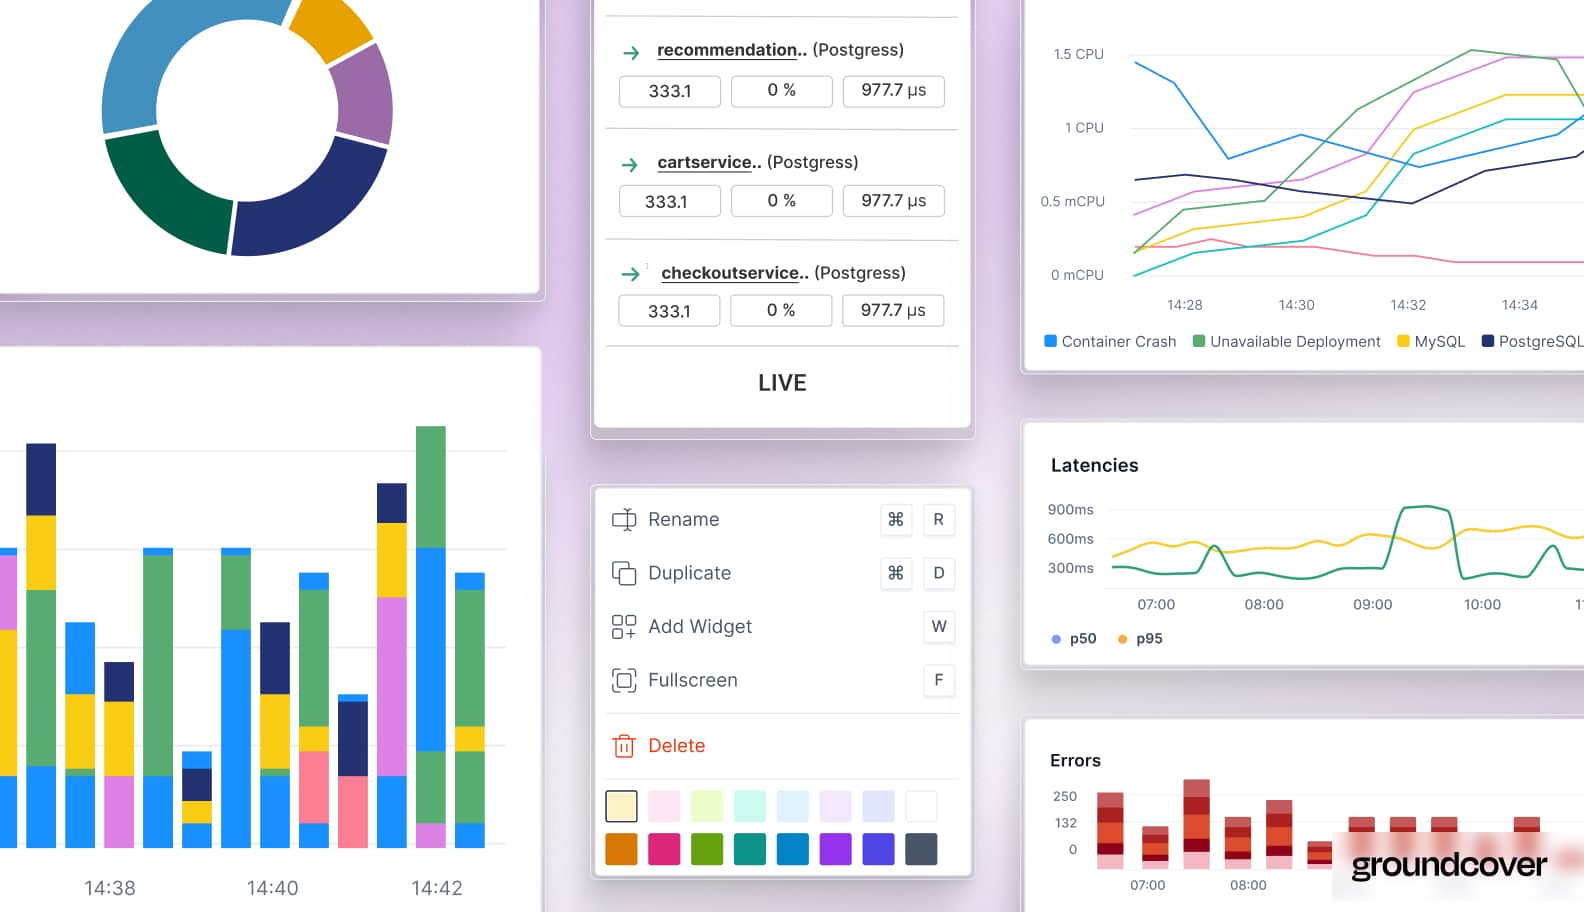
At groundcover, we’re constantly innovating to make observability simpler, faster, and more efficient. Today, we’re thrilled to announce a new feature that will transform how Kubernetes environments are monitored and troubleshooted: One-Click Kubernetes Dashboards. Powered by the cutting-edge technology of eBPF (extended Berkeley Packet Filter), these dashboards bring a new level of visibility and convenience to engineering teams—without the need for complex configurations.
This exciting feature marks a major milestone in our mission to streamline cloud-native observability. Let’s take a look at what these dashboards offer and how they’ll change the way you manage Kubernetes environment observability.
Speed and simplicity are essential for teams working in fast-paced environments, and that’s exactly what groundcover’s One-Click Kubernetes Dashboards deliver. Gone are the days of spending time configuring complex dashboards or switching between different monitoring tools to troubleshoot problems.
With a single click, engineers can instantly spin up a native Kubernetes dashboard designed specifically for their tech stack. These dashboards provide a high-level view of the health of Kubernetes nodes and clusters, and they’re fully interactive, allowing teams to drill into deeper insights with minimal effort. Whether you’re responding to an alert or proactively monitoring system performance, these dashboards put critical data at your fingertips, reducing the time spent on manual investigations.
The secret behind the speed and efficiency of these dashboards lies in eBPF—a technology that provides deep, real-time insights into system behavior with virtually no performance overhead. Traditionally, collecting detailed telemetry data has been resource-intensive and challenging, but eBPF allows us to gather granular insights without impacting system performance.
This powerful integration means groundcover’s dashboards aren’t just about basic metrics. They give you access to deep, context-rich telemetry that can help uncover root causes faster, enabling quicker decision-making and reducing time to resolution (MTTR). This level of detail and efficiency sets groundcover apart from traditional observability tools.
One of the core innovations of our One-Click Kubernetes Dashboards is the seamless integration between monitoring and data exploration. Most monitoring platforms require users to manually switch between various tools and dashboards when they need to investigate an issue further. With groundcover, the transition from visualization to data exploration is effortless.
Once a dashboard is generated, you can quickly pivot to deep-dive data exploration to troubleshoot specific problems. Whether you start with a dashboard or an alert, the bi-directional flow of information makes it easy to investigate the data from multiple perspectives. Thanks to groundcover’s common data model, this seamless experience is possible across all our observability tools—meaning you can explore and troubleshoot without ever losing context.
In addition to eBPF, we’ve also integrated OpenTelemetry, another CNCF-incubating project, into our observability platform. This integration enables engineers to trace communication between services within their Kubernetes clusters. By combining OpenTelemetry with eBPF, groundcover unlocks even richer data—such as the user ID associated with a request, the device used, and detailed error messages.
This expanded visibility allows teams to understand how services interact within the system and spot potential performance bottlenecks or failures before they impact users. Whether you're tracking requests across microservices or diving into the specifics of an individual container, this combined data gives you a holistic view of your infrastructure’s performance.
While advanced observability is at the core of groundcover, we always prioritize user experience. Many existing monitoring solutions require engineers to master complex query languages and manually configure dashboards. With groundcover, we’ve simplified this process without sacrificing depth or functionality.
Our Query Bar offers a simple, intuitive interface that makes it easy to generate and explore queries. This empowers even less technical users to interact with data without needing deep expertise in PromQL or SQL. The Infra Metrics feature goes even further, providing pre-configured, key infrastructure metrics so you don’t have to manually memorize complex metric names or structures. With native Kubernetes dashboards integrated directly into the platform, groundcover eliminates the need to jump between various tools, streamlining the workflow and enhancing overall productivity.
At groundcover, we believe that observability should be simple, integrated, and frictionless. The release of our One-Click Kubernetes Dashboards is just one part of our ongoing commitment to building a unified observability experience that empowers teams to monitor, troubleshoot, and optimize their systems effortlessly.
Unlike traditional monitoring tools that offer fragmented or clunky user interfaces, groundcover’s platform is designed for smooth integration across monitoring, alerting, and data exploration. Our approach ensures that teams can stay focused on what matters most: improving system performance and building great products.
The launch of these dashboards is just the beginning. We’re continually iterating on our observability platform, incorporating feedback from our users to make the experience even better. Our goal is to redefine the speed and efficiency of troubleshooting by providing teams with more context and more control over their Kubernetes environments.
If you’re attending KubeCon London, we invite you to visit our booth and see the One-Click Kubernetes Dashboards in action. Our team will be there to answer your questions, give you a live demo, and help you understand how eBPF-driven observability can transform the way you manage Kubernetes clusters.
Keep up with all things cloud-native observability.
We care about data. Check out our privacy policy.


