.jpg)

Reading the term “memory leak” in the title might have brought up some unpleasant memories for some of you. Indeed, this type of bug can cause immense confusion and frustration for even the most experienced developers. This was exactly the case for us at groundcover - but luckily, we ended up not only solving the issue, but also coming up with some new tricks for the future. Did anyone say “pprof”?
The issue at hand
Some time ago, we noticed that one of our core services started getting consistent OOM errors during normal operation. Looking at the service’s memory profile showed a textbook memory leak pattern:

The service starts accumulating memory right from the get-go, growing steadily until reaching the defined memory limits, afterwards it is killed with an OOM error. Bummer.
Memory leaks in golang
This is a good time to note that the leaking service is written in pure golang, which uses garbage collection as part of the language runtime. This mechanism takes care of freeing unused memory for us, so in theory it should prevent memory leaks from happening. What’s going on?
From past readings we suspected the issue might have to deal with the runtime not releasing memory back to the OS fast enough - but this was fixed in go 1.16.
With no other leads, it was time to get right into the thick of it - using pprof.
pprof
pprof is one of those tools which make you smile, then cry over time wasted not using them, and then smile again. It’s just that good. Available with the golang installation by default, it lets developers easily get extensive profiling data for their applications. This includes CPU and memory usage alongside more complex runtime information. To top everything off, it’s incredibly easy to use, requiring one import in your module and a running web server. That’s it.
The right tool for the job
Since our problem is a memory one, we figured we should use pprof to check out our service’s memory profile, running the following command:
go tool pprof –-inuse_space http://localhost:6060/debug/pprof/heap

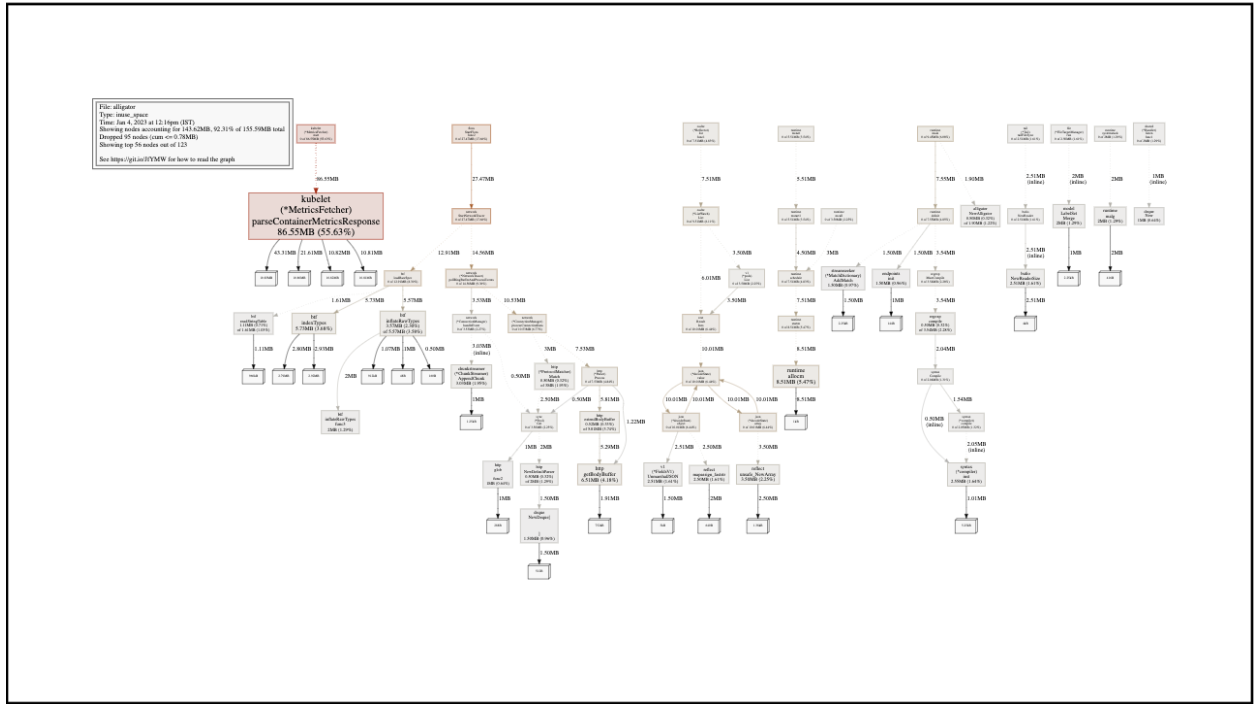
The resulting diagram shows the heap memory which is currently in use by our service. Red, larger blocks mean more memory; gray, smaller ones mean less memory. The name on the block is the function which is responsible for the initial allocation of the memory. Note that this doesn’t mean that function is still using that memory, or that the function is even still running - the allocated object might have been passed around to other functions and goroutines.
Our case looks rather simple, with one block popping out immediately:

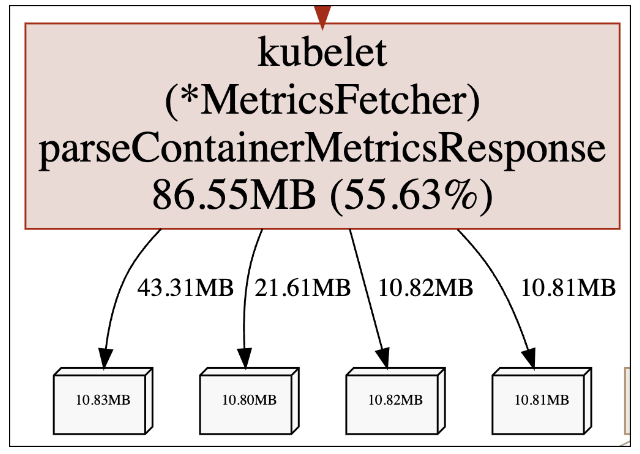
It seems that the MetricsFetcher.parseContainerMetricsResponse function is responsible for the allocation of 55.63% of our current live heap. Knowing our service, this is definitely not intended behavior.
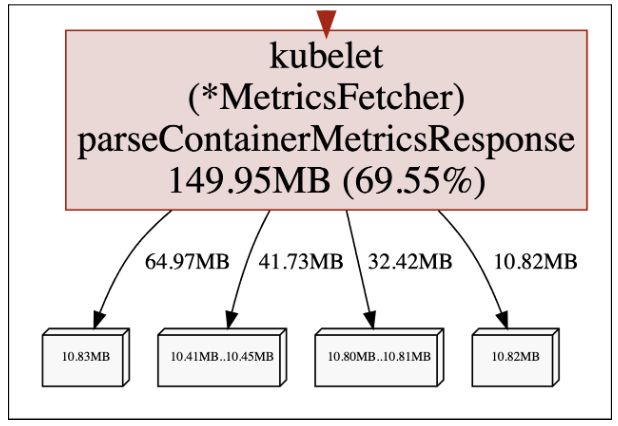
To make sure this isn’t a momentarily memory spike, we checked again after a while:

The in-use memory is growing over time! This is consistent with our memory leak pattern, so it seems we might have found the root cause of our issue. Now what?
Enhance!
The function above is simply a parsing function - it shouldn’t keep so much data alive. While pprof points it out as being responsible for the allocation of the leaky memory, the real question is why is that memory not freed afterwards, by the caller of the function.
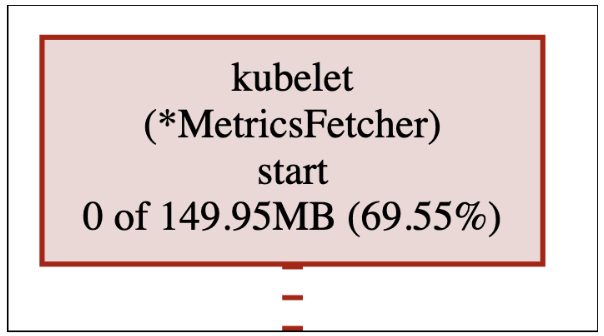
It’s time to use another amazing pprof feature. Looking at the memory profile above, it doesn’t only track where memory was allocated, but also the entire call flow leading to the allocation! In the next part of the series we will delve into how this mind-blowing feature is implemented. For now, let’s take a look at who called the function:

The MetricsFetcher.start starts the call flow which eventually leads to leaking the memory. We can see it generates 0 MB of data itself, but is indirectly accountable for 69.55% of the current live heap - which as we already know, is allocated inside MetricsFetcher.parseContainerMetricsResponse.
To make things even easier for us, let’s use another cool pprof feature that lets us change the graph granularity from functions to lines:

We can now pinpoint the exact lines which eventually lead to allocating the leaky memory - fetcher.go, lines 80 and 142.
It’s all about the flow
Let’s break down the above functions to try and understand what goes wrong. We already know that leaking flow begins here, in line 80:


.jpg)
.jpg)


.svg)