Observability isn’t SaaS. It’s yours.
Monitor everything you run in the cloud or on-prem without compromise. Get 10x more data for a fraction of the cost, all kept private & secure inside your cloud.


From the limits of SaaS to BYOC freedom
Own your observability with lower costs, full data, zero maintenance, and the freedom to run anywhere.
All-in-One Observability Features
From infrastructure to applications to LLMs, groundcover gives you every capability you need with no tiers, no gates, no limits.


groundcover:
Observability that just works
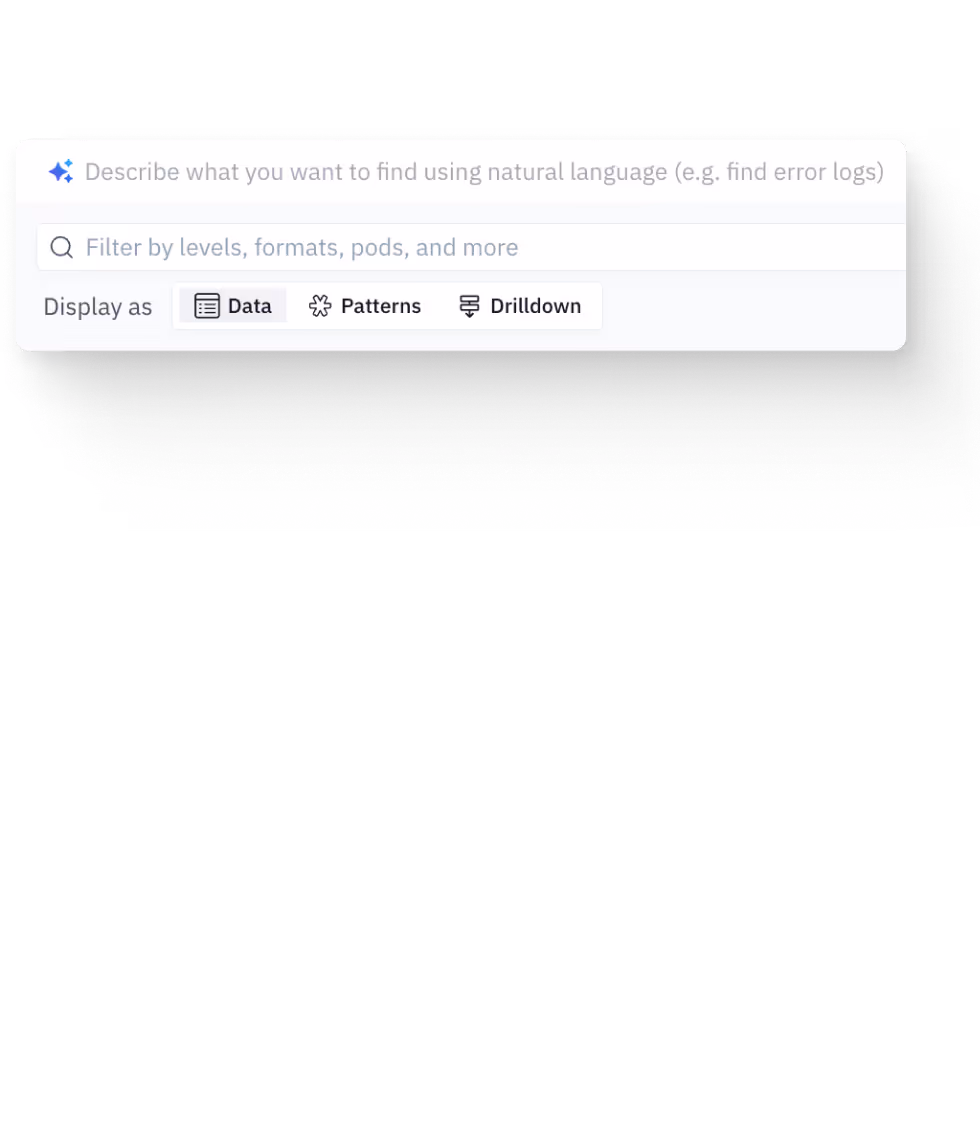
Deploy once, and groundcover does the rest. Our eBPF-powered sensor streams enriched telemetry across your stack — no code changes, no heavy setup.

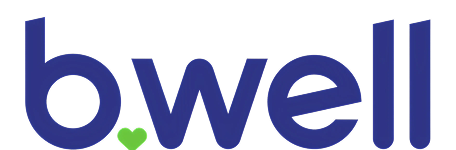
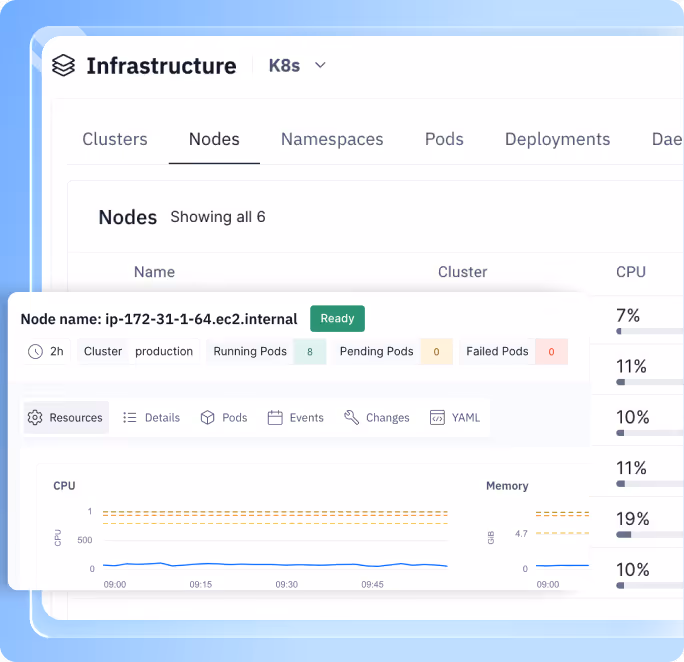
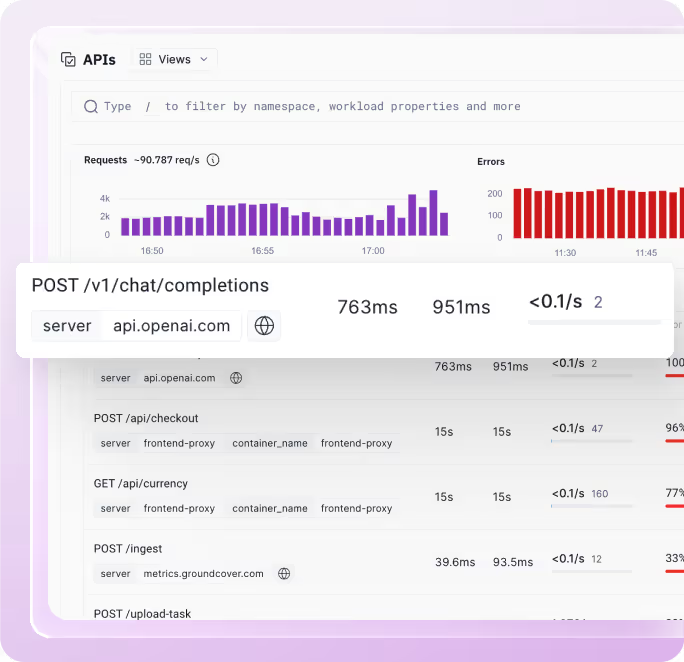
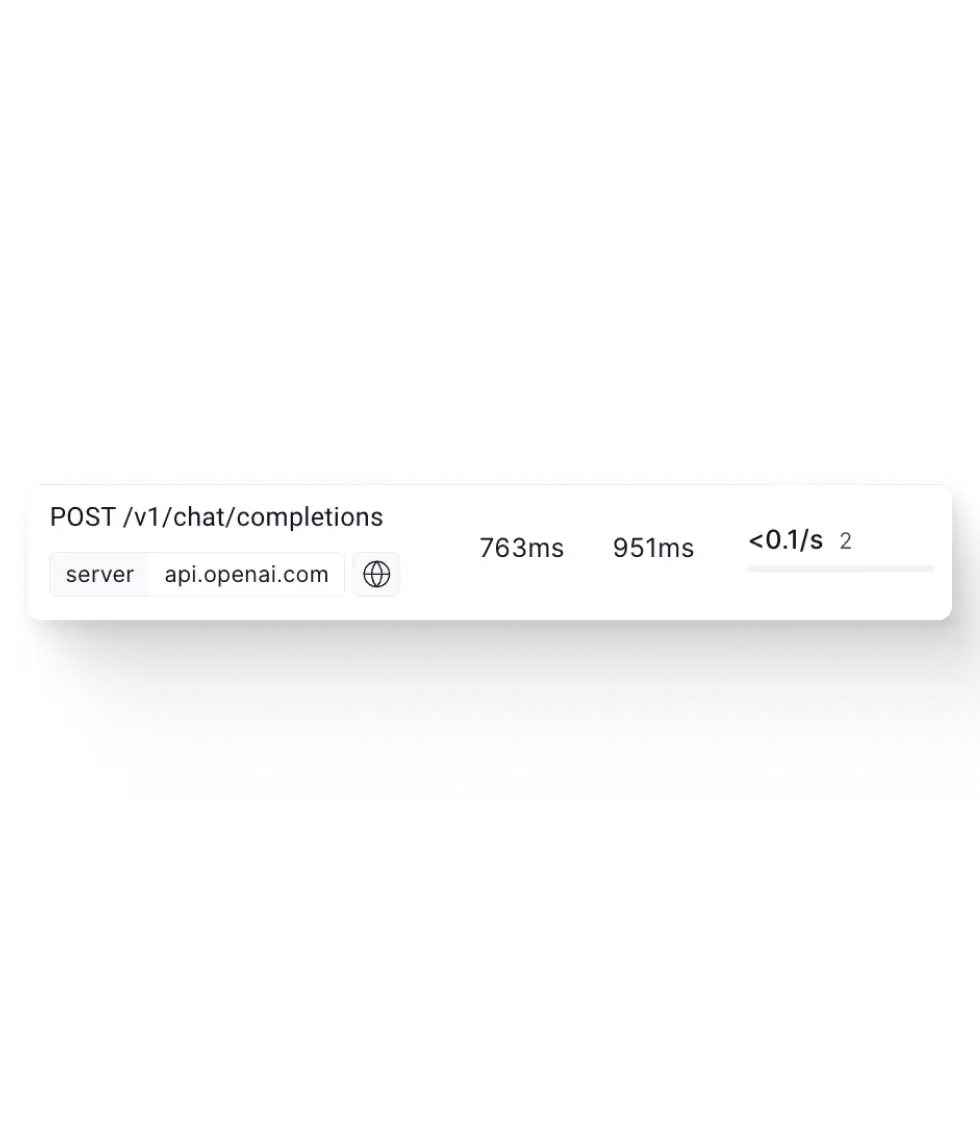
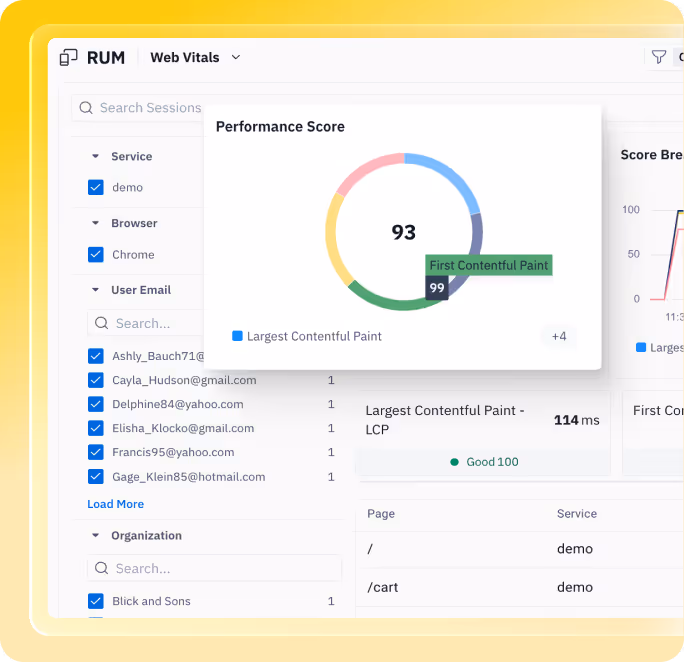
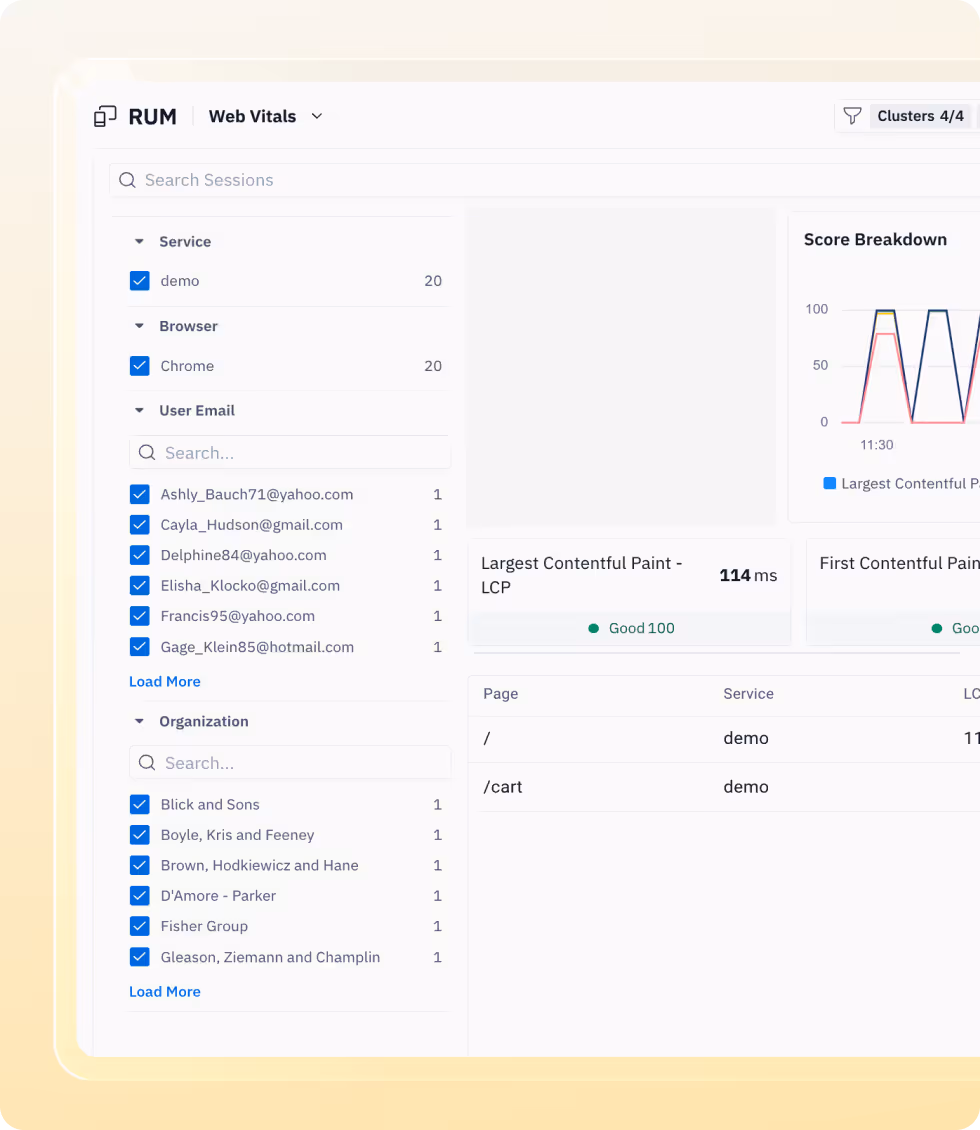
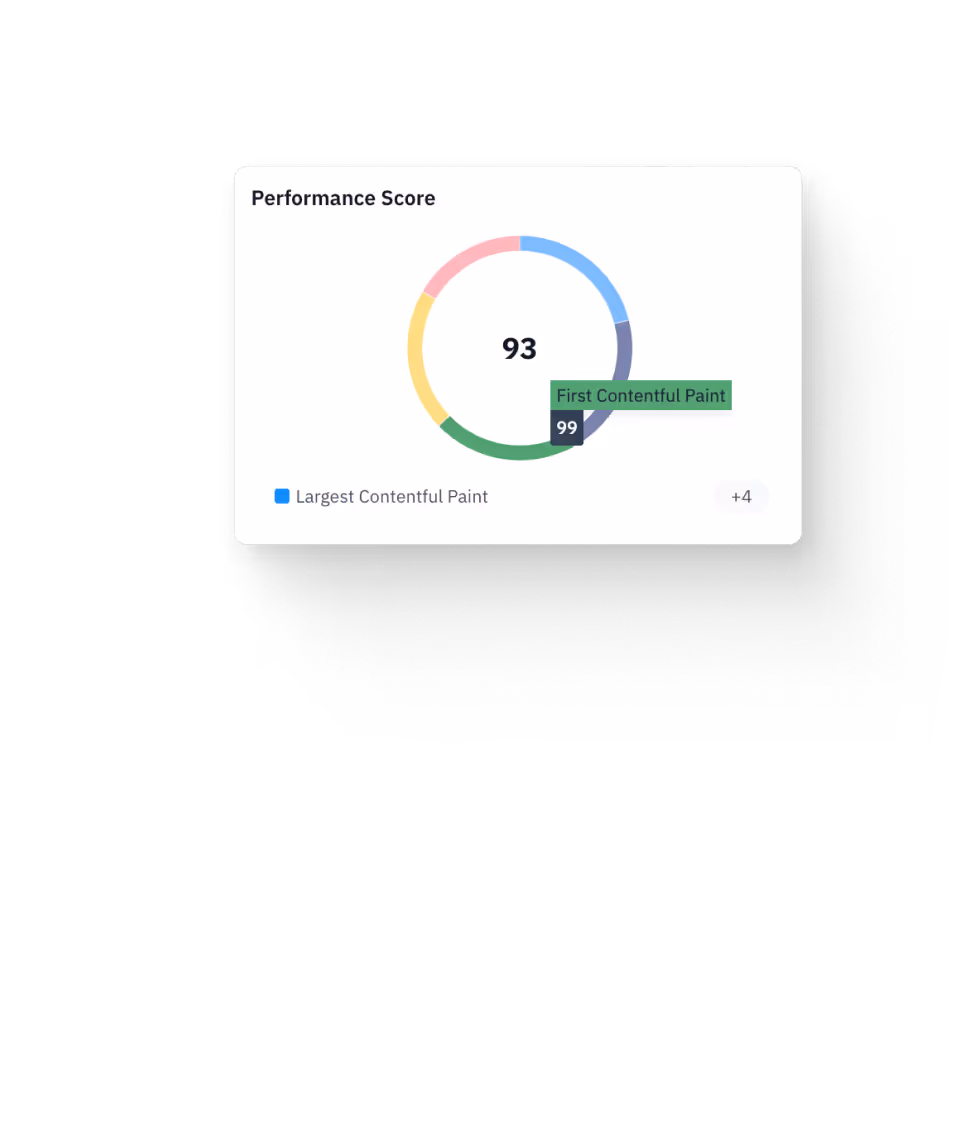
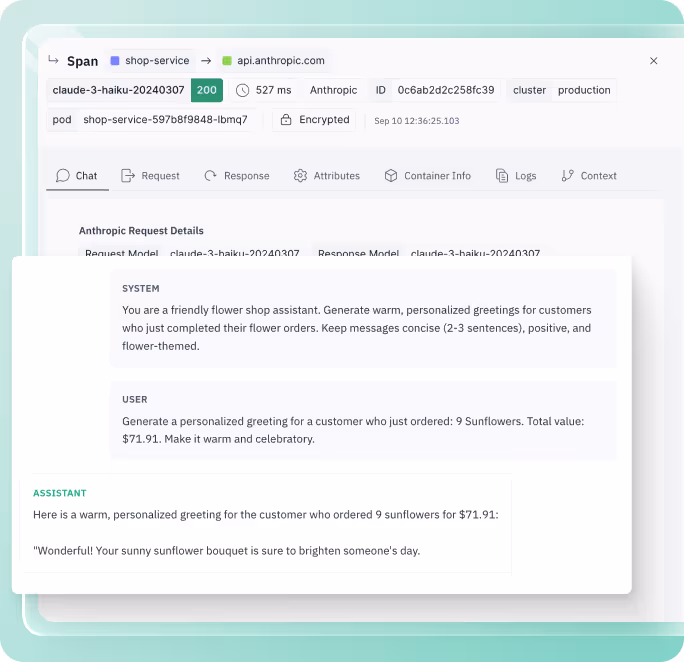
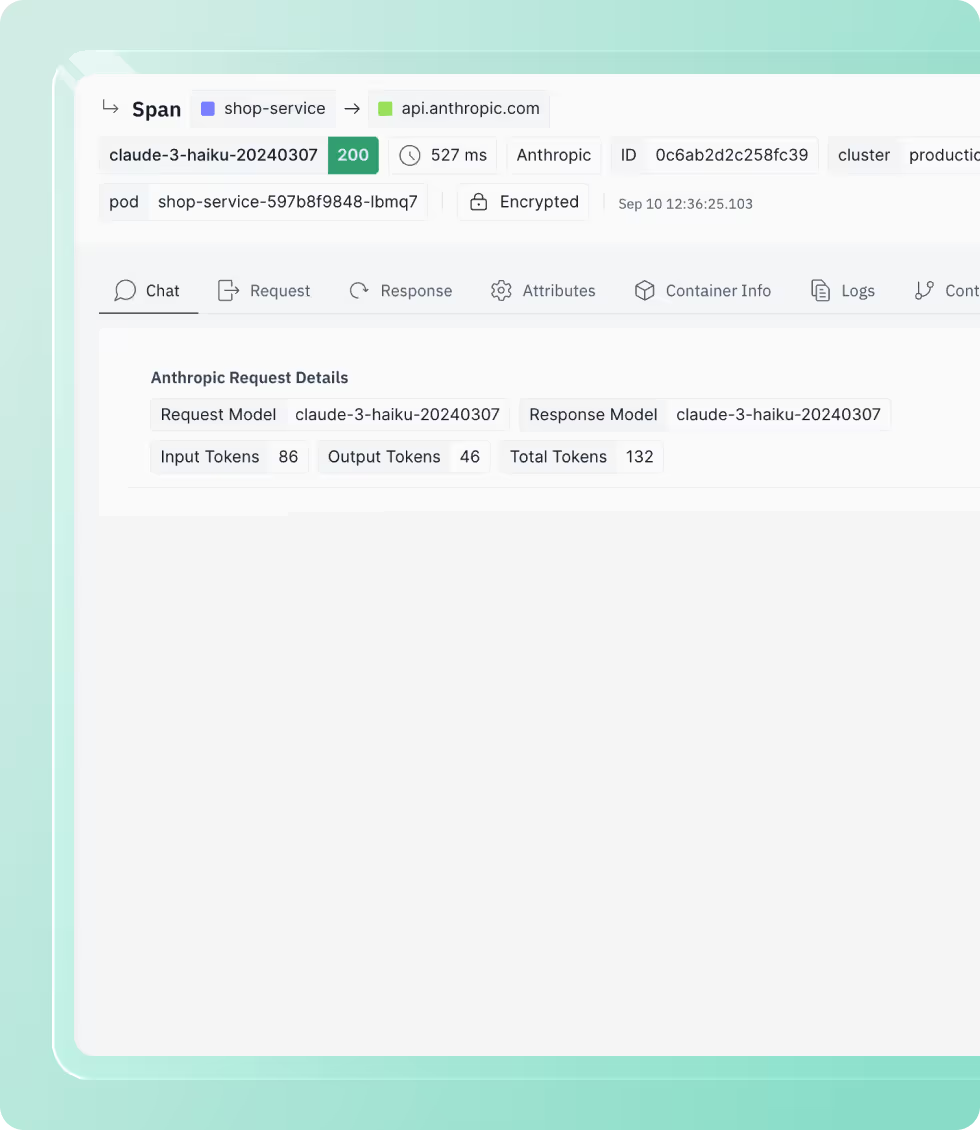
Complete visibility→ The whole truth
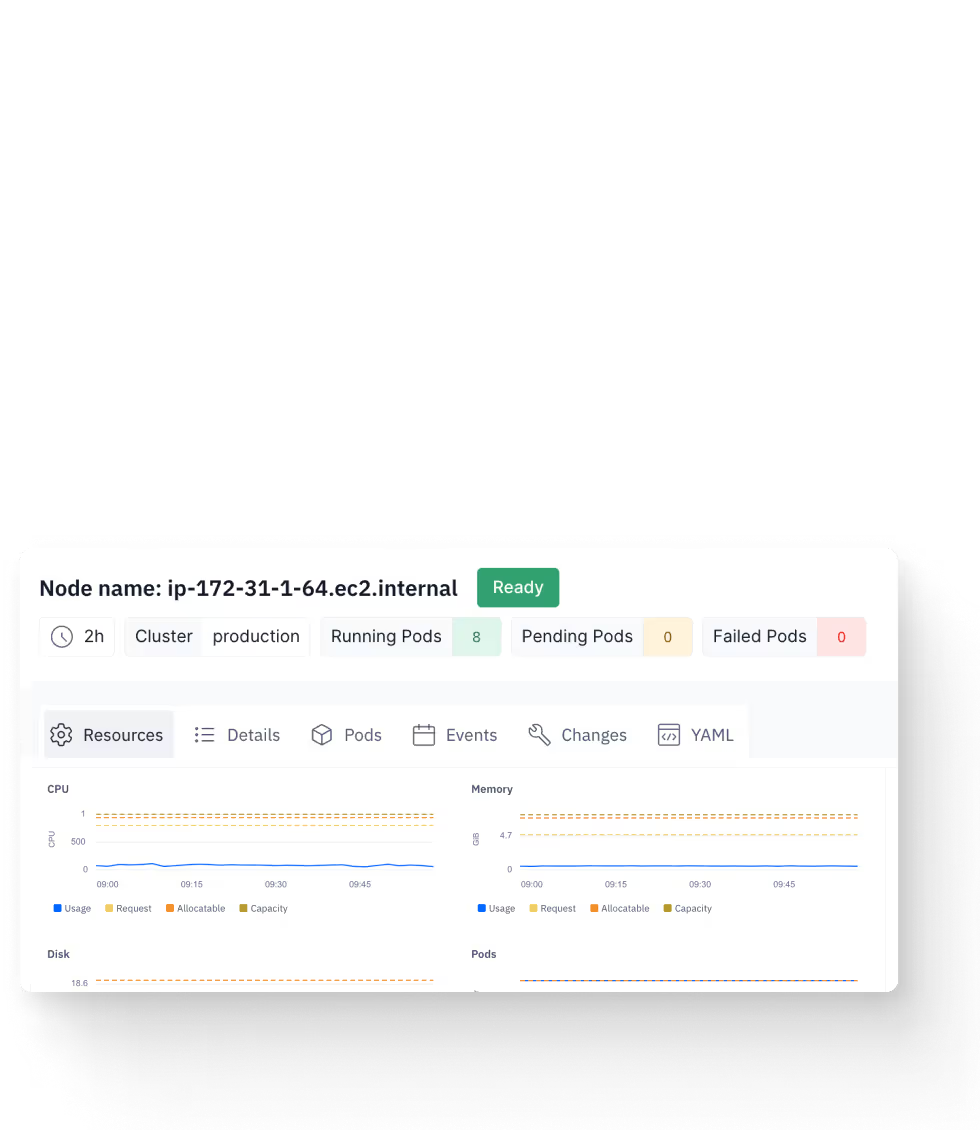
From infra to apps to LLMs, groundcover ties logs, traces, and metrics together automatically — delivering context engineers shouldn’t have to stitch together.

Zero instrumentation→ Zero friction
Powered by eBPF, groundcover deploys instantly. No code changes, no implementation cycles — just full coverage out of the box.

Flat, predictable pricing → No surprises
No ingestion taxes. No hidden penalties. Just simple per-host pricing, period.
Built for scale→ Unlimited by design
Minimal footprint. Infinite cardinality. Infinite retention. Always fast, no matter the load.

All-inclusive observability→ No gates
Every feature. Unlimited. No tiers. No tradeoffs. Observability without restrictions.

Trusted by teams who demand more
Real teams, real workloads, real results with groundcover.

“We cut our costs in half and now have full coverage in prod, dev, and testing environments where we previously had to limit it due to cost concerns.”

Sushant Gulati
Sr Engineering Mgr, BigBasket

“Observability used to be scattered and unreliable. With groundcover, we finally have one consolidated, no-touch solution we can rely on.“

ShemTov Fisher
DevOps team lead
Solidus Labs

“We went from limited visibility to a full-cluster view in no time. groundcover’s eBPF tracing gave us deep Kubernetes insights with zero months spent on instrumentation.”

Kristian Lee
Global DevOps Lead, Tracr

“The POC took only a day and suddenly we had trace-level insight. groundcover was the snappiest, easiest observability platform we’ve touched.”

Adam Ceresia
Software Engineering Mgr, Posh

“All vendors charge on data ingest, some even on users, which doesn’t fit a growing company. One of the first things that we liked about groundcover is the fact that pricing is based on nodes, not data volumes, not number of users. That seemed like a perfect fit for our rapid growth”

Elihai Blomberg,
DevOps Team Lead, Riskified

“We got a bill from Datadog that was more then double the cost of the entire EC2 instance”

Said Sinai Rijcov,
DevOps Engineer at EX.CO.

“We ditched Datadog’s integration overhead and embraced groundcover’s eBPF approach. Now we get full-stack Kubernetes visibility, auto-enriched logs, and reliable alerts across clusters with zero code changes.”

Eli Yaacov
Prod Eng Team Lead, Similarweb
Make observability yours
Stop renting visibility. With groundcover, you get full fidelity, flat cost, and total control — all inside your cloud.


.svg)