Observability, for the Cloud.

Monitor everything you run in the cloud without compromising on cost, granularity, or scale. Collect logs, metrics and traces instantly with eBPF, and store them inCloud, on your infrastructure, managed by us.

Monitor everything you run in the cloud without compromising on cost, granularity, or scale. Collect logs, metrics and traces instantly
with eBPF, and store them inCloud, on your infrastructure, managed by us.

Trusted by:

Next-Gen Observability: Harness the power of eBPF & inCloud

Get instant out-of-the-box insights, from logs to full traces and troubleshoot faster with unlimited data, all in your control

Diagram showing next-gen observability with groundcover's eBPF sensor connected to inCloud architecture.
  • Our eBPF sensor allows for zero implementation cycles, zero code changes, and full coverage, out of the box.

  • Data never leaves your cloud
premises, stored cost-effectively through our inCloud architecture.

  • Monitor everything, from infrastructure to application, in one crisp and blazing fast interface.

The APM
Easy button is here.

100% visibility,
all the time.

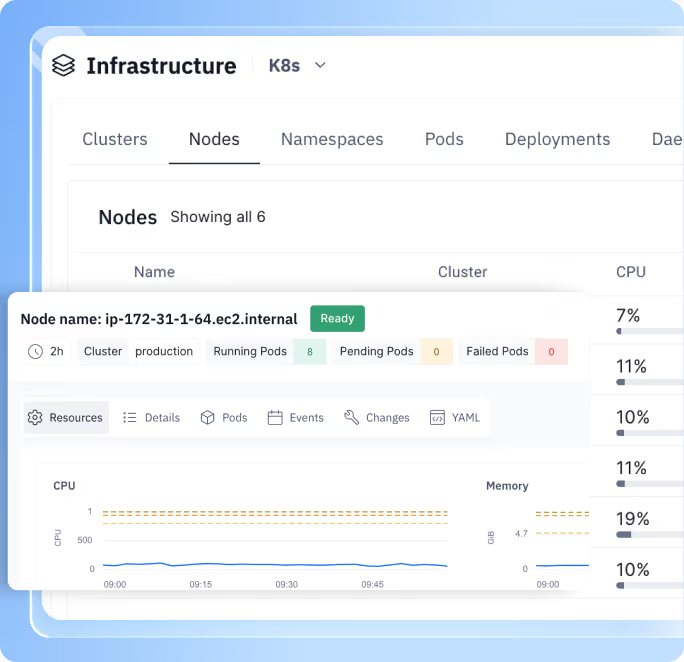
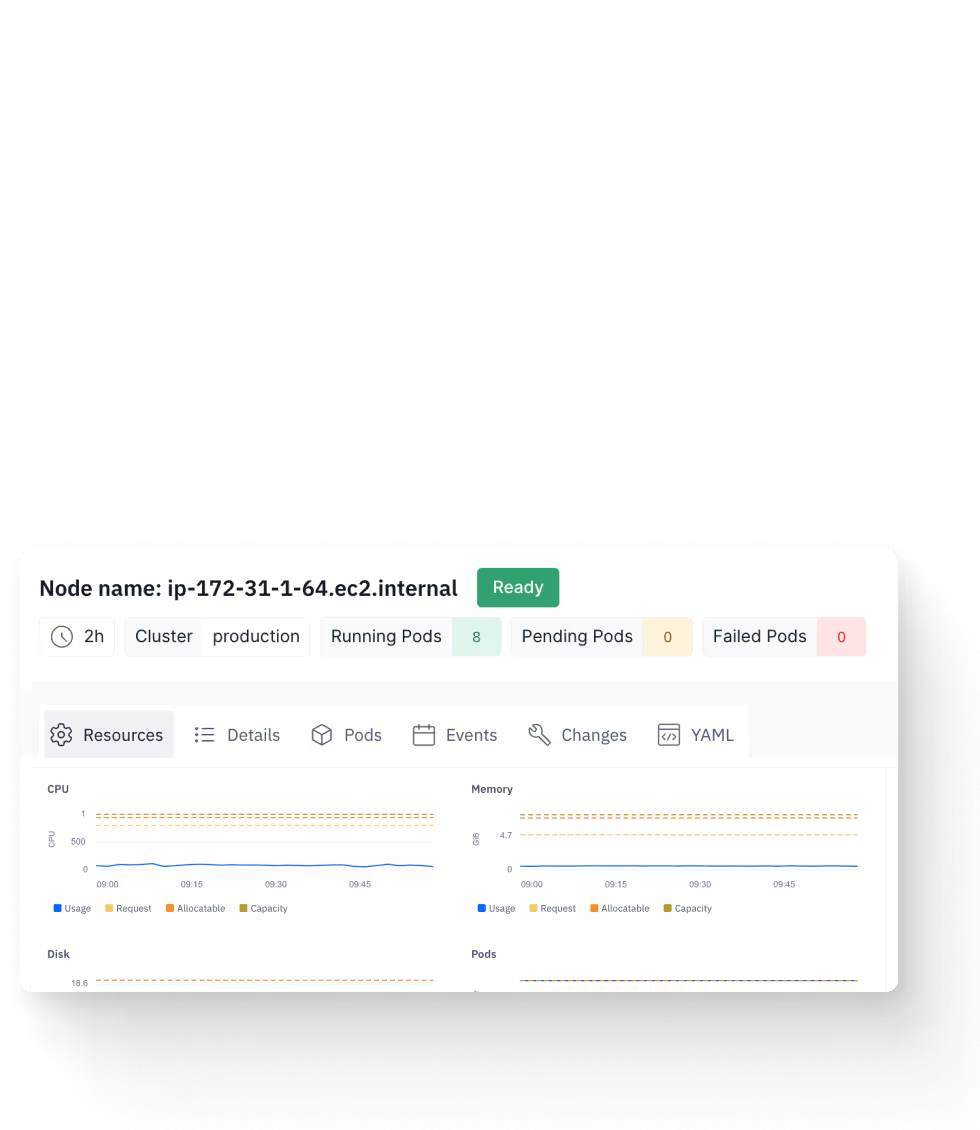
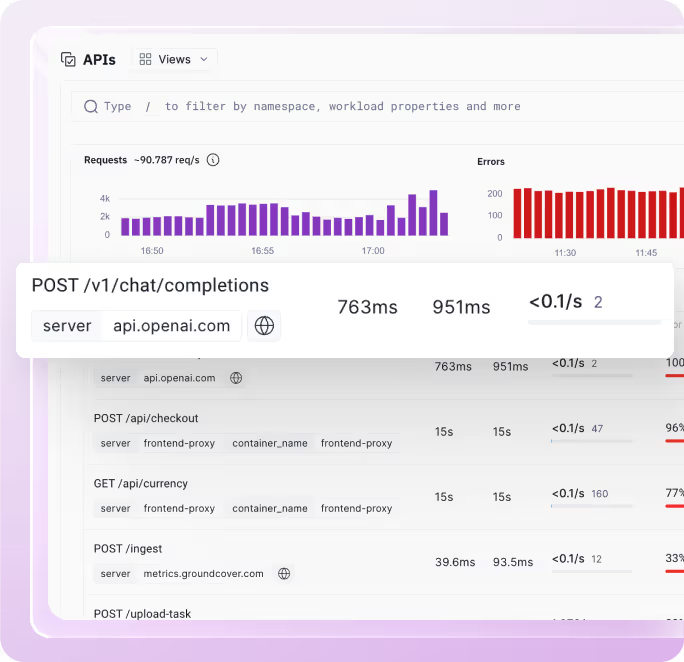
Cover your entire Kubernetes stack instantly with no code changes using the superpowers of eBPF instrumentation.

Detect & solve bleeding issues, effortlessly.

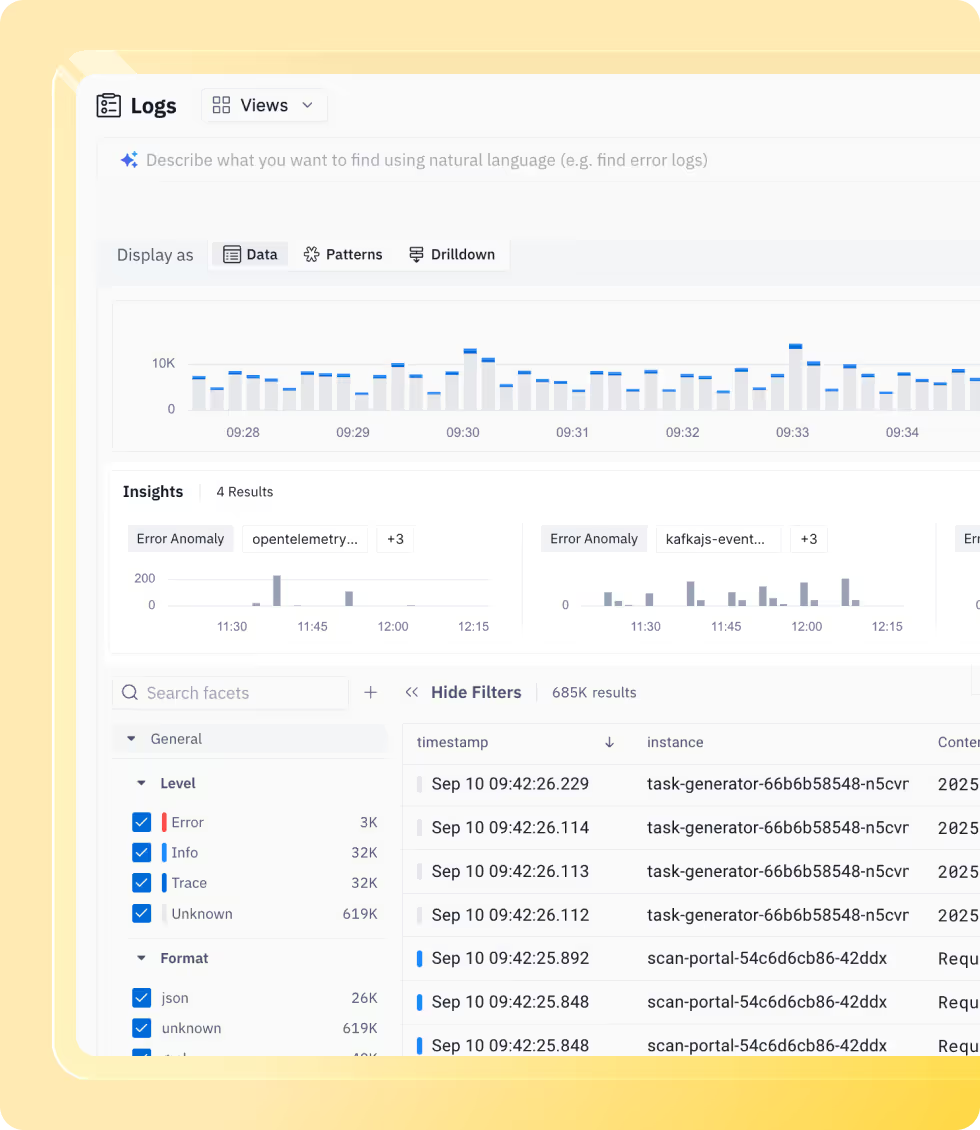
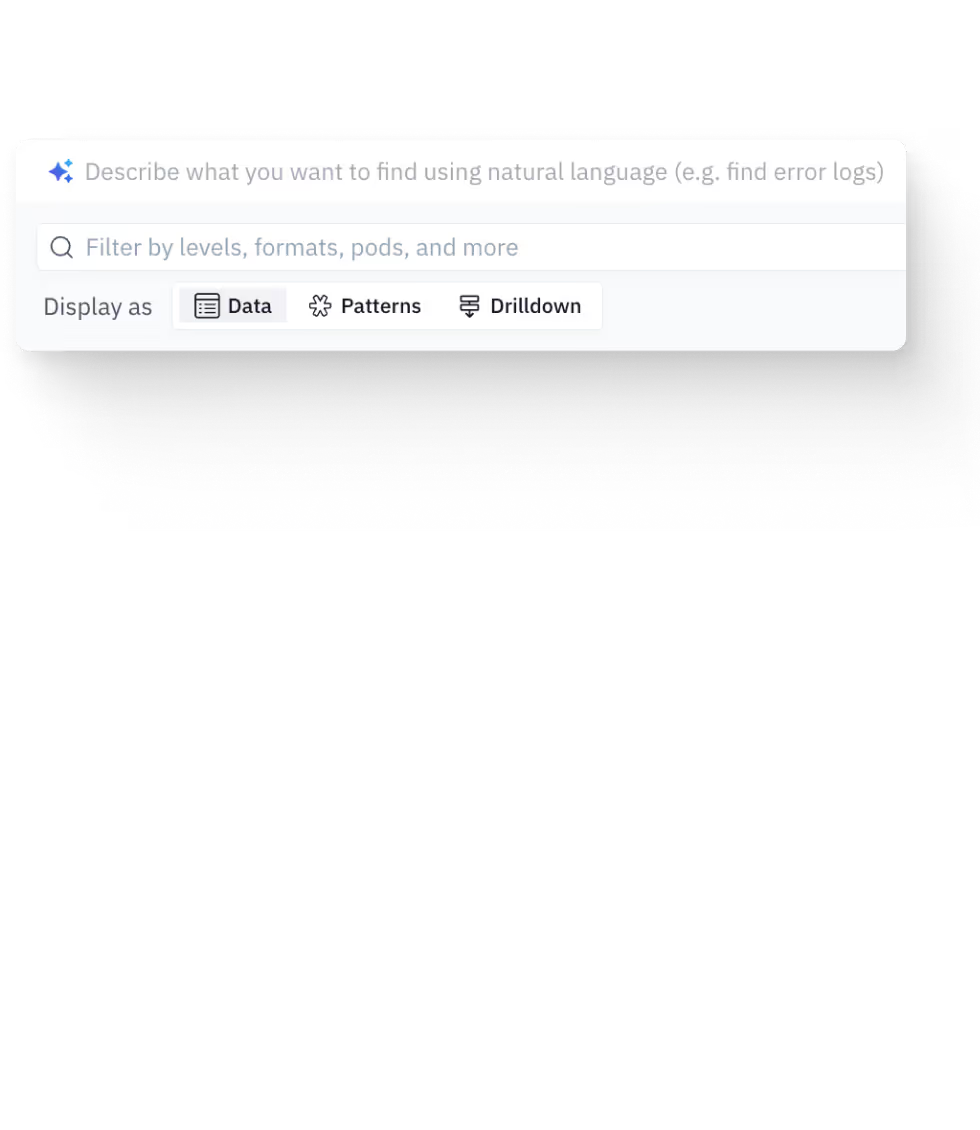
Deploy anywhere, within minutes. Troubleshoot & improve your application and infrastructure performance with K8s context and mind-blowing data granularity.

Take control of your data, all in-cloud.

groundcover’s unique in-cluster architecture keeps your data private, secured and under your control without ever leaving your cluster.

Dramatic Cost Reduction,
Endless Scale.

Control your budget and avoid unexpected spikes in cost with a flat, predictable price. No more tough trade-offs about which parts of your production to observe. With transparent per-Node pricing you can cover it all, for a fraction of the cost.

*Based on 500 nodes, 1TB of ingested Logs and Traces per day, and 500K Active Metrics

Full-stack Observability
for your Cloud, in one place.

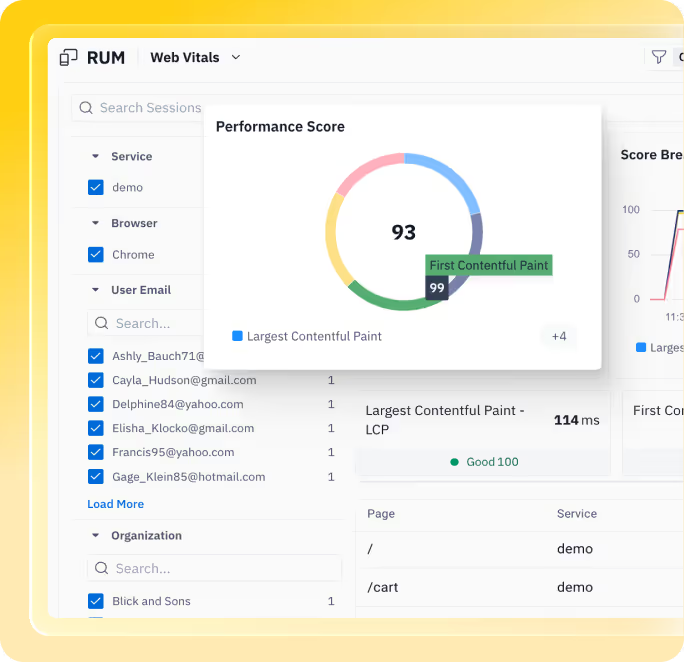
Tap into all application logs, metrics, traces and Kubernetes events. Get full K8s-native observability from infrastructure to application, with one solution.

Get started on any environment

Check out how to get started

EKS

Amazon

Elastic Kubernetes Service

AKS

Azure

Kubernetes Service

GKE

Google

Kubernetes Engine

Check out how to get started

Integrate with any data source, from anywhere.

Stream any source of logs, metrics, and traces directly into groundcover's inCloud backend using any protocol supported by OpenTelemetry or Prometheus. Using Grafana? Add our Prometheus compatible datasource directly into your Grafana to enrich your dashboards with loads of new out-of-the-box metrics.

CloudWatch

Monitor AWS resources and applications with CloudWatch.

Grafana

Connect any Grafana datasource into groundcover for a unified experience.

OpenTelemetry

Ingest and visualize OpenTelemetry data directly in groundcover.

Prometheus

Let groundcover scrape your Prometheus custom metrics.

Istio

Manage microservices with Istio’s powerful service mesh.

FluentD

Collect and unify log data with FluentD.

InfluxDB

Store and analyze time-series data with InfluxDB.

logstash

Ingest, transform, and send logs with Logstash’s flexible data pipeline.

As seen on

Start monitoring, everything.

Deploy groundcover on your environment in minutes, or explore it on our data before lighting up your own cluster.